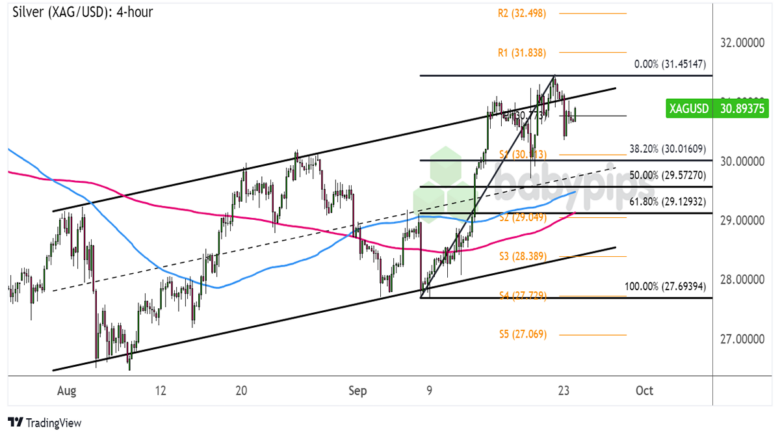
It looks like this precious metal busted out of that reversal pattern we were watching earlier and is now gaining traction on its climb.
Can it go for a major correction soon?
Check out these inflection points I’m watching on the 4-hour chart!

Silver (XAG/USD) 4-hour Forex Chart by TradingView
Gold has recently surged to fresh all-time highs once again, so can silver follow in its footsteps as well?
After a bit of a rocky reaction to the FOMC decision, this precious metal appears inclined to carry on with its climb, making another attempt to break above its ascending channel top.
Can resistance hold again?
Remember that directional biases and volatility conditions in market price are typically driven by fundamentals. If you haven’t yet done your homework on the U.S. dollar and silver, then it’s time to check out the economic calendar and stay updated on daily fundamental news!
As you can see from the chart above, silver is still hovering at the resistance near the pivot point level ($30.773). If the ceiling keeps holding, price could retreat back to nearby support zones marked by the Fibonacci retracement tool.
The 38.2% level is near S1 ($30.016) then the 50% Fib is closer to the mid-channel area of interest at $29.572. The 61.8% retracement is in line with S2 ($29.049) and the 200 SMA dynamic inflection point. The 100 SMA is above the 200 SMA to suggest that support levels are more likely to hold than to break, potentially sending silver back up to the swing high and beyond.
If silver bulls are too excited to charge, XAG/USD could simply make a break for the recent highs at $31.450 and go for a steeper climb to the next upside targets at R1 ($31.838) then R2 ($32.498).
Don’t forget to practice proper risk management and stay aware of top-tier market catalysts when trading this one. Good luck!
