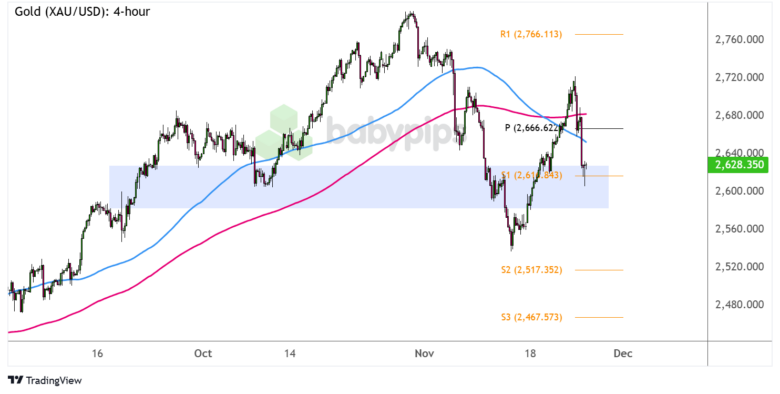
Is that a head and shoulders pattern I’m seeing on the 4-hour chart of spot gold?
Or is the longer-term climb more likely to resume soon?
Take a look at these inflection points I’m watching!

Gold (XAU/USD) 4-hour Forex Chart by TradingView
Safe-haven rallies leading up to the U.S. elections seem to be unwinding, as investors are actually feeling optimistic about economic prospects under President-elect Trump’s administration.
Not only have stock traders been pricing in business-friendly policies, but markets are also cheering the selection of Treasury Secretary Scott Bessent, who is known for being level-headed and will likely prevent an all-out global trade war from happening.
Does this mean that gold’s uptrend has come to an end?
Remember that directional biases and volatility conditions in market price are typically driven by fundamentals. If you haven’t yet done your homework on gold and market sentiment, then it’s time to check out the economic calendar and stay updated on daily fundamental news!
The precious metal seems to be forming a sketchy head and shoulders pattern on its 4-hour time frame, and the latest dip has taken XAU/USD down to the neckline around $2,650.
A break below the support zone around S1 ($2,614.84) could set off a downtrend that’s around the same height as the chart formation, possibly dragging gold to the next bearish targets at S2 ($2,517.35) then S3 ($2,467.57).
If the floor holds, on the other hand, look out for a bounce back to the pivot point level ($2,666.62) near the dynamic inflection points at the moving averages or up to the highs near R1 ($2,766.11).
As always, watch out for other top-tier catalysts that could impact overall market sentiment, and make sure you practice proper position sizing when taking any trades!
