EUR/CHF has shown renewed bullish momentum in recent sessions, pushing up from the 0.9300 area to test a significant technical resistance confluence around the 0.9400 handle.
Check out these key inflection points we’re watching on the 4-hour time frame:

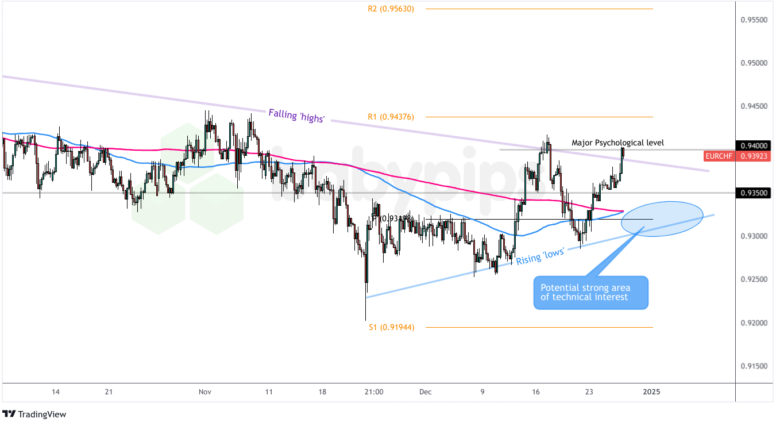
EUR/CHF 4-hour Forex Chart by TradingView
EUR/CHF has been caught in a wide consolidation pattern through December, following a grinding downtrend that began in September 2024. The pair is now challenging a critical technical junction as it approaches the convergence of multiple resistance factors.
Remember that directional biases and volatility conditions in market price are typically driven by fundamentals. If you haven’t yet done your homework on the euro and the Canadian dollar, then it’s time to check out the economic calendar and stay updated on daily fundamental news!
Looking at the technicals, price action is testing both the falling ‘highs’ pattern that’s been in place since September and the major psychological level of 0.9400. The 100 SMA is a touch below the 200 SMA in the 0.9330 area, suggesting bears still have control of the medium-term trend, but the recent formation of rising ‘lows’ indicates growing bullish pressure.
For bears, the current test of resistance around 0.9400 could present an opportunity, as this level aligns perfectly with the descending trendline of lower highs. With the pair having rallied over two daily ATR from 0.9300 over the past week, profit-taking could emerge here after the extended move.
If bearish reversal patterns form, we could see a move back towards the strong technical confluence around the 0.9320 area, where the monthly pivot point meets both moving averages and the rising ‘lows’ pattern.
However, if bulls manage to push above 0.9400 with conviction and can sustain trade up there, that may attract technical buyers on net and we could see an extension towards the R1 pivot level at 0.9437, and potentially even the R2 pivot at 0.9563 (but this would likely require a fundamental catalyst to fuel that kind of move). The rising ‘lows’ pattern suggests growing bullish momentum, though counter-trend traders should exercise extra caution given the overall downtrend since September.
Whichever bias you end up trading, don’t forget to practice proper risk management and stay aware of the few economic catalysts ahead that could disrupt this ranging behavior during the holiday period.