Student loan debt affects everyone from young college grads to retirees. While younger borrowers dominate the headlines, the data tells a more complex story—one where graduate students hold a disproportionate share of debt and older Americans face unexpected repayment struggles, sometimes well into their golden years.
Did you know that a growing number of retirees are seeing their Social Security checks garnished to repay long-defaulted loans? Or that borrowers with smaller balances tend to pay off their loans faster, leaving those with higher degrees to carry the financial burden for decades? These are just some of the striking patterns revealed in the latest federal student loan data.
The majority of borrowers owe less than $40,000 in federal student loan debt. Borrowers with more than $100,000 in federal student loan debt tend to be graduate and professional school students, and parents of dependent undergraduate students.
Very few borrowers still owe federal student loans when they reach retirement age, and those tend to have been in default for a very long time. And almost all federal student loan debt is repaid within 30 years.
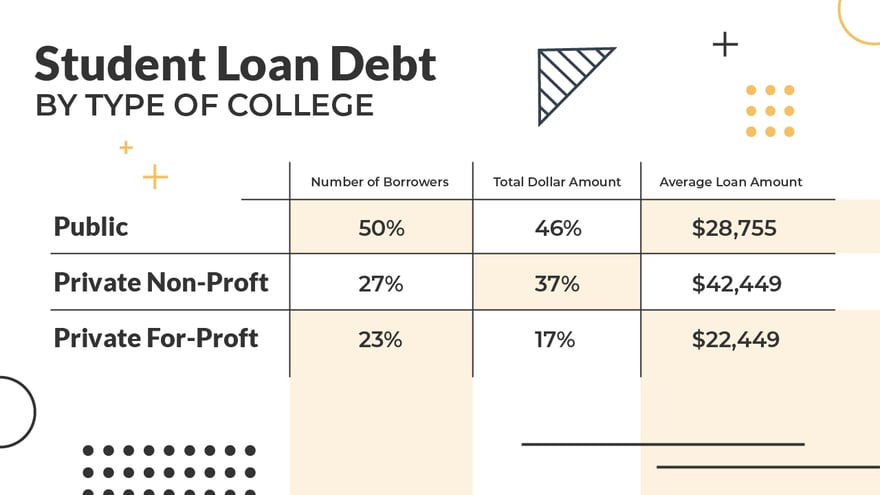
Only about a quarter of federal student loan borrowers attended for-profit colleges, with half of borrowers having attended public colleges.
Let’s break down the data for the 42.7 million Americans that have student loan debt.
Borrower Age
This table shows the distribution of the number of borrowers and the total amount of debt by borrower age, as of September 30, 2024.

Although only 6% of borrowers are age 62 and older, the U.S. Government Accountability Office (GAO) found that they are disproportionately in default.
Nearly a third of borrowers age 65 and older are in default (27% of borrowers age 65-74 and 54% of borrowers age 75 and older), compared with 19% of borrowers age 50-64, 12% of borrowers age 25-49 and 3% of borrowers under age 25. When a borrower is unable to repay their student loans, the student loan debt persists into old age.

This can affect the financial security of retired persons, since the federal government can offset up to 15% of Social Security retirement benefits to repay defaulted federal student loans. The offset of Social Security benefit payments – money that retirees need to pay for food, housing and medicine – is a morally bankruptcy policy. The federal government gives with one hand while taking back with the other.
Amount Of Debt Per Borrower
This table shows the distribution of the number of borrowers and the total amount of debt by borrower age by the amount of debt per borrower, as of September 30, 2024.

Three quarters of borrowers (74%) owe less than $40,000 in student loan debt.
Even though only 8% of borrowers owe $100,000 or more, collectively these borrowers represent 40% of total federal student loan debt outstanding. These borrowers likely include more graduate student loan borrowers than undergraduate borrowers.
Type Of College
This table shows the distribution of the number of borrowers and the total amount of debt by borrower age by the type of college, as of September 30, 2024.

Although private for-profit colleges get blamed for delivering less value to their students, they represent less than a quarter of all borrowers and less than a fifth of total student loan debt, in part because they represent a smaller percentage of college enrollment.
Default rates were affected by the payment pause during the pandemic, and the 12-month on-ramp after the pandemic. The default rate measures the percentage of loans entering repayment during one federal fiscal year that default by the end of the third following federal fiscal year. Accordingly, it will take several years after the end of the pandemic before the cohort default rates yield meaningful measurements.
Immediately prior to the pandemic, private for-profit colleges represented 19% of the loans entering repayment, but 29% of the loans entering default. The default rate of borrowers at for-profit colleges was one-and-a-half times the average overall default rate.
This compares with private non-profit colleges, which were 25% of the loans entering repayment and 18% of the loans entering default, and public colleges, which were 56% of the loans entering repayment and 54% of the loans entering default.
Distribution Of Student Loan Debt By Age And Debt Size
This table shows the distribution of the number of borrowers by debt size and borrower age, as of September 30, 2024.

More than half of borrowers are under age 50 and owe less than $40,000.
Among borrowers owing less than $40,000, the number of borrowers peaked at age 25-34 and then declines as the borrowers get older. Among borrowers owing $40,000 or more, the number of borrowers peaked at age 35-49 and then declines as the borrowers get older. The greater age may be a sign of the impact of debt from graduate and professional school.
This table shows the distribution of total student loan dollars by debt size and borrower age, as of September 30, 2024.

This table shows the average student loan amount by debt size and borrower age, as of September 30, 2024.
There is not much variation within each debt size group, except for the youngest age group, which tends to have a higher average loan amount for debt size $40,000 to $200,000 and a lower average loan amount for debt size of $200,000 or more.

You can find more student loan debt statistics here.
More Stories:
