WTI crude oil has been on a bullish run so far this week, but are the rallies about to hit a roadblock soon?
Or is the energy commodity gearing up for a big breakout?
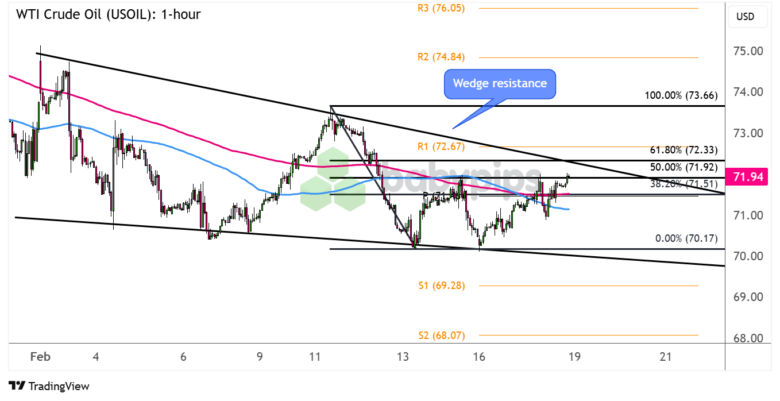
Take a look at these nearby inflection points on the hourly chart.

WTI Crude Oil (USOIL) 1-hour Chart by TradingView
In case you missed it, there have been rumors of the OPEC+ considering a delay in its planned production hike for April on account of stronger global supply estimates. After all, peace talks between Russia and Ukraine could mean more of the former’s oil exports flowing freely back in the markets.
This tug-o-war between supply forces could keep the energy commodity in its wedge consolidation pattern, as crude oil recently formed lower highs and slightly lower lows.
Will resistance keep holding?
Remember that directional biases and volatility conditions in market price are typically driven by fundamentals. If you haven’t yet done your homework on WTI crude oil and the U.S. dollar, then it’s time to check out the economic calendar and stay updated on daily fundamental news!
WTI crude oil is already inching closer to testing the wedge top that happens to be in line with the 61.8% Fibonacci retracement level near R1 ($72.67 per barrel), so keep your eyes peeled for reversal candlesticks that could suggest a return in selling pressure.
If that’s the case, look out for a move back to the swing low at $70.17 per barrel or the wedge support closer to the $70 per barrel major psychological mark.
On the other hand, long green candlesticks past R1 could point to a bullish breakout, followed by an uptrend that’s the same height as the chart formation. If that happens, stay on the lookout for potential bounces off nearby resistance zones at R2 ($74.84 per barrel) then R3 ($76.05 per barrel).
Whichever bias you choose to trade, don’t forget to keep tabs on this week’s set of top-tier news events, as well as any headlines that could impact market sentiment, when taking any trades.