Is the trend still our friend on CAD/JPY?
This yen pair appears to be in correction mode to a support-turned-resistance zone that lines up with a falling trend line.
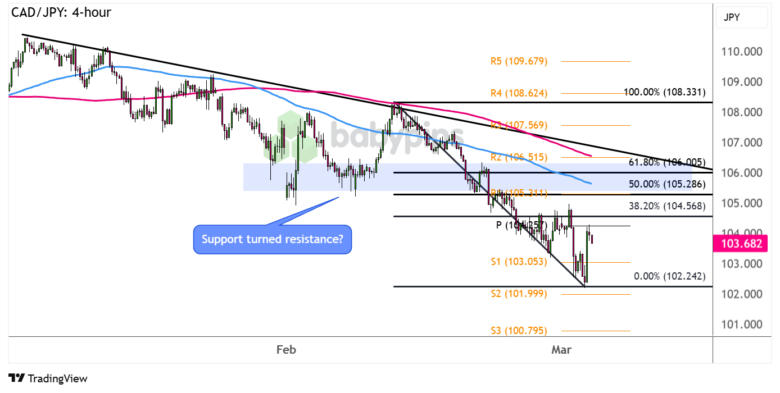
Take a look at this area of interest on the 4-hour chart!

CAD/JPY 4-hour Forex Chart by TradingView
A combination of hawkish Bank of Japan (BOJ) vibes, risk-off flows, and falling crude oil prices have kept this pair in a downtrend so far this year.
CAD/JPY has formed lower highs connected by a descending trend line, and it looks like another pullback to this resistance zone is in the works.
The Fibonacci retracement tool shows additional levels where Loonie bears may be hanging out, so do you think the selloff is about to resume soon?
Remember that directional biases and volatility conditions in market price are typically driven by fundamentals. If you haven’t yet done your homework on the Japanese yen and Canadian dollar, then it’s time to check out the economic calendar and stay updated on daily fundamental news!
Price is closing in on the 38.2% Fibonacci level near the pivot point (104.25) but could still go for a larger pullback to the 50% Fib that’s right in line with R1 (105.31) or the 61.8% level closer to the trend line and 200 SMA dynamic resistance.
The 100 SMA is below the 200 SMA on this time frame, hinting that the path of least resistance is to the downside or that the selloff is more likely to resume than to reverse. In that case, if any of the Fibs hold, look out for a continuation of the slide back to the swing low near S2 (101.99).
Still, keep your eyes peeled for long green candlesticks piercing through the area of interest and trend line, as these could suggest that a major reversal is in order. If this happens, Loonie bulls could set their sights on R3 (107.56) then R4 (108.62) next.
As always, watch out for other top-tier catalysts that could impact overall market sentiment, and make sure you practice proper position sizing when taking any trades!