Could the Kiwi be tired from its decline against the Japanese yen?
I’m seeing a potential reversal chart pattern suggesting so on its 4-hour time frame!
Better keep your eyes on this neckline resistance, as a break could set off a rally that’s the same height as the formation.

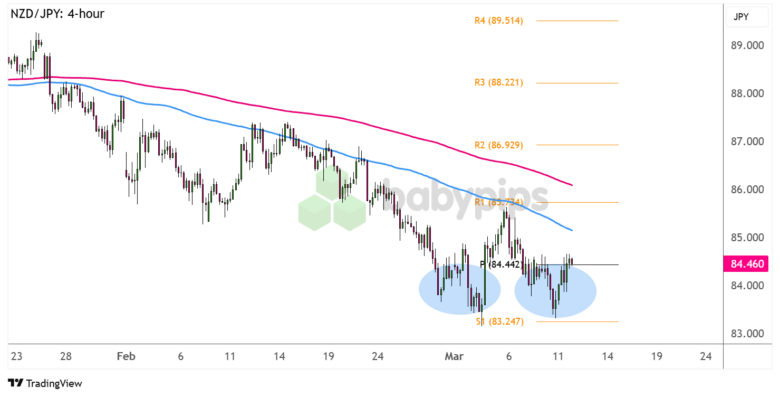
NZD/JPY 4-hour Forex Chart by TradingView
This yen pair made a couple of failed attempts to break below the 83.25 mark, creating a double bottom pattern with the neckline around the 85.75 level.
NZD/JPY has yet to test and break above the resistance to suggest that an uptrend of the same height as the formation could follow.
So, is the trend still our friend on this one?
Remember that directional biases and volatility conditions in market price are typically driven by fundamentals. If you haven’t yet done your homework on the New Zealand dollar and Japanese yen, then it’s time to check out the economic calendar and stay updated on daily fundamental news!
Hawkish BOJ expectations, combined with plenty of risk-off vibes from tariffs-related uncertainty, have been propping the safe-haven yen higher versus the Kiwi since the start of the year.
At the same time, a relatively dovish RBNZ that kept the door open for further easing in their next policy decisions has kept a lid on the New Zealand dollar’s rallies.
On its 4-hour hour chart above, the 100 SMA is still below the 200 SMA to suggest that the selloff is more likely to resume than to reverse. If the ceiling around R1 (85.73) and the neckline keeps holding, look out for a continuation of the slide back down to the recent lows at S3 (83.24) or lower.
On the other hand, a break above the resistance around the 200 SMA dynamic inflection point could pave the way for a move to the next bullish targets at R2 (86.92) then R3 (88.22).
As always, watch out for other top-tier catalysts that could impact overall market sentiment, and make sure you practice proper position sizing when taking any trades!