Gold has been in correction mode recently, but is the precious metal finally ready to resume its climb soon?
Check out these nearby support zones that could attract bulls!

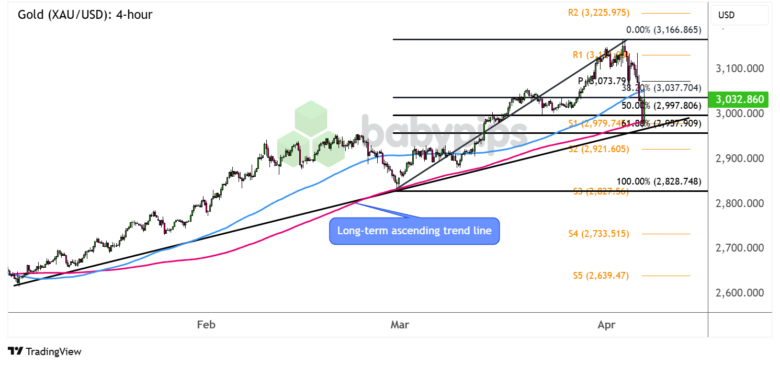
Gold (XAU/USD) 4-hour Chart by TradingView
Even with escalating global trade tensions after “Liberation Day” gold has shed a good chunk of its recent safe-haven gains.
After hitting one record high after another, the precious metal has retreated to the long-term rising trend line that’s been holding so far this year.
Is this merely a pullback from its steady climb or is the uptrend about to turn soon?
Remember that directional biases and volatility conditions in market price are typically driven by fundamentals. If you haven’t yet done your homework on gold and the U.S. dollar, then it’s time to check out the economic calendar and stay updated on daily fundamental news!
Gold is currently hanging out at an area of interest that lines up with the 61.8% Fibonacci retracement level, 200 SMA dynamic support, and a former resistance zone at S1 ($2,979.74).
Keep your eyes peeled for reversal candlesticks that could suggest a bounce off the support level, possibly taking the precious metal back up to the swing high near R1 ($3,131.93) or to new highs at R2 ($3,225.97).
On the other hand, look out for potential bearish candles that could suggest a break below the trend line and a possible reversal from the climb. If this happens, gold could test the next support area at S2 ($2,921.60) then set its sights on S3 ($2,827.56) near the swing low.
Just keep in mind that the 100 SMA is still above the 200 SMA to reflect the presence of bullish vibes that could keep the uptrend intact, although is starting to dip below the latter, too.
Whichever bias you end up trading, don’t forget to practice proper risk management and stay aware of top-tier catalysts that could influence overall market sentiment!