Is gold’s uptrend about to reach its end?
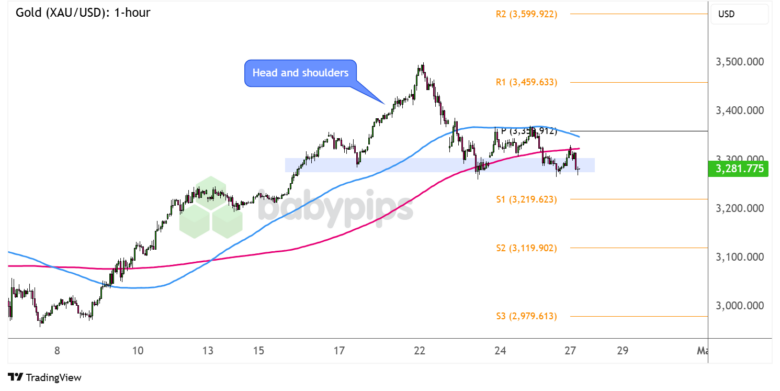
On the hourly chart below, you can see that the precious metal is completing a head and shoulders formation.
Here’s why I’m keeping this short-term classic chart pattern on my radar.

Gold (XAU/USD) 1-hour Chart by TradingView
Gold hit fresh record highs last week on overall USD weakness after U.S. President Trump criticized Fed head Powell’s tight monetary policy regime, spurring expectations for pressure on the central bank to cut rates.
However, the precious metal soon returned its safe-haven gains while market sentiment improved as the week went on and the U.S. economy also showed signs of resilience in its flash PMI readings.
Is gold in for more losses in case risk appetite picks up?
Remember that directional biases and volatility conditions in market price are typically driven by fundamentals. If you haven’t yet done your homework on the gold and the U.S. dollar, then it’s time to check out the economic calendar and stay updated on daily fundamental news!
XAU/USD is already testing the neckline of its head and shoulders pattern, so a break below the support around the $3,300 major psychological mark could suggest that bearish pressure is returning.
If this happens, look out for a sustained drop to the next downside targets at S1 ($3,219.62) then S2 ($3,119.90) or a selloff that’s the same height as the chart formation.
On the other hand, a bounce off current levels could keep gold moving sideways, possibly recovering to the near-term resistance at the pivot point level ($3,359.91) near the 100 SMA dynamic inflection point.
Note that the 100 SMA is above the 200 SMA for now to reflect the presence of bullish vibes, although the gap between the indicators is narrowing to hint at a possible downward crossover.
Whichever bias you end up trading, don’t forget to practice proper risk management and stay aware of top-tier catalysts that could influence overall market sentiment!