Is CHF/JPY’s trend still our friend or has it reached the bend at the end?
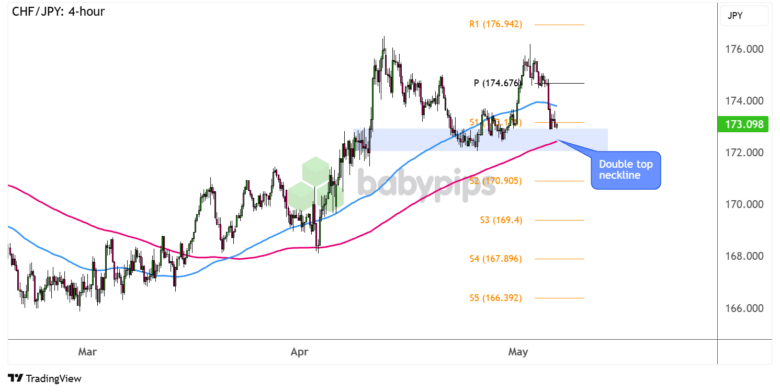
A double top chart pattern can be seen on its 4-hour time frame with the pair still waiting to get downtrend confirmation.
Better keep this potential reversal formation on your radar in case we get a neckline break!

CHF/JPY 4-hour Forex Chart by TradingView
Just last week, the Bank of Japan turned its hawkishness down a notch in their May policy statement, leading to a sharp dip for the yen.
Its selloff against the Swiss franc did not last long, though. After all, the Swiss National Bank isn’t feeling too optimistic about its economy either, and policymakers are still wary of safe-haven inflows to the currency.
Can the prospect of SNB currency intervention keep dragging CHF/JPY lower?
Remember that directional biases and volatility conditions in market price are typically driven by fundamentals. If you haven’t yet done your homework on the Swiss franc and the Japanese yen, then it’s time to check out the economic calendar and stay updated on daily fundamental news!
CHF/JPY is already closing in on its double top neckline support, and a break lower could confirm that a downtrend of the same height as the pattern (roughly 400 pips) is due.
Although the 100 SMA is above the 200 SMA to suggest that the path of least resistance is to the upside, keep your eyes peeled for a possible move below the 200 SMA dynamic support that could clear the way for a drop to the next downside targets at S2 (170.90) then S3 (169.40).
Then again, reversal candlesticks forming at the 172.00-173.00 support zone could still lead to another bounce back to the tops at the 176.00 major psychological mark or at least until the pivot point level (174.67).
Whichever bias you end up trading, don’t forget to practice proper risk management and stay aware of top-tier catalysts that could influence overall market sentiment!