EUR/GBP has formed lower highs and slightly lower lows to consolidate in a wedge pattern.
Is the pair in for a breakout soon and which levels can it go for next?
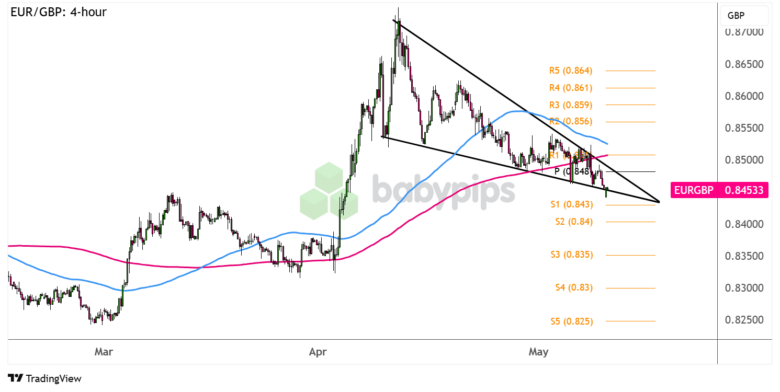
Take a look at these inflection points on the 4-hour time frame:

EUR/GBP 4-hour Forex Chart by TradingView
Just last week, the U.S. announced a trade deal with the U.K. that sparked a strong pound rally. After all, this puts the U.K. on much safer footing compared with other major economies being threatened by Trump with his additional tariffs.
On the flip side, the EU appears to be facing more trade jitters and has even released a “hit list” of U.S. imports to target in case talks turn sour.
Can this spur a downside wedge breakout for EUR/GBP?
Remember that directional biases and volatility conditions in market price are typically driven by fundamentals. If you haven’t yet done your homework on the euro and the British pound, then it’s time to check out the economic calendar and stay updated on daily fundamental news!
The pair is already approaching the decision point of its falling wedge pattern while the consolidation keeps getting tighter and tighter.
Look out for red candlesticks forming below support around the .8450 minor psychological mark, as this could set off a drop to the next bearish targets at S1 (.8430) then S2 (.8400) or even a downtrend that’s the same height as the wedge pattern.
On the other hand, a strong bounce back above the pivot point level (.8480) could spur a bullish wedge breakout and pave the way for a move to the upside levels at R1 (.8510) then R2 (.8560).
Whichever bias you end up trading, don’t forget to practice proper risk management and stay aware of top-tier catalysts that could influence overall market sentiment!