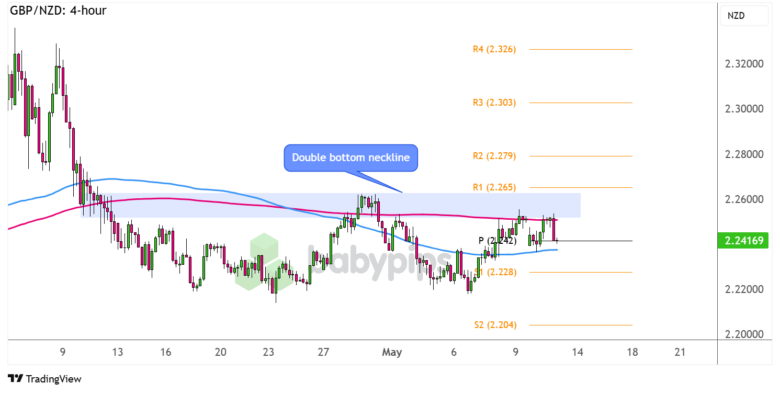
GBP/NZD made a couple of failed attempts to close below the 2.2200 handle, creating what appears to be a double bottom pattern.
Or is it just about to move sideways from here?

GBP/NZD 4-hour Forex Chart by TradingView
A less dovish than expected BOE decision last week lifted GBP/NZD close to its double bottom neckline at the 2.2600 major psychological level, as a couple of MPC members surprisingly voted to keep policy on hold.
However, positive developments on the U.S.-China trade front also gave the Kiwi a significant boost and the improved risk sentiment dragged the pair back to the pivot point level (2.2420).
Where could it be headed next?
Remember that directional biases and volatility conditions in market price are typically driven by fundamentals. If you haven’t yet done your homework on the New Zealand dollar and the British pound, then it’s time to check out the economic calendar and stay updated on daily fundamental news!
The 100 SMA is still below the 200 SMA on this time frame, suggesting that the path of least resistance is to the downside. Keep an eye out for candlesticks closing below the pivot point, as these could clear the way for a move back to the lows below S1 (2.2280) or even to S2 (2.2040).
On the other hand, a bounce off current levels could spur another test of the neckline resistance or R1 (2.2650) at a minor psychological level. Watch out for a break above this area that could confirm the potential uptrend, which could last by the same height as the double bottom or roughly 400 pips.
Stay on your toes for potential bounces off near-term resistance levels at R2 (2.2790) then R3 (2.3030) as well.
Whichever bias you end up trading, don’t forget to practice proper risk management and stay aware of top-tier catalysts that could influence overall market sentiment!
Disclaimer:
Please be aware that the technical analysis content provided herein is for informational and educational purposes only. It should not be construed as trading advice or a suggestion of any specific directional bias. Technical analysis is just one aspect of a comprehensive trading strategy. The technical setups discussed are intended to highlight potential areas of interest that other traders may be observing. Ultimately, all trading decisions, risk management strategies, and their resulting outcomes are the sole responsibility of each individual trader. Please trade responsibly.