NZD/USD is having trouble extending a downswing beyond a technical support zone.
Are we looking at a potential countertrend setup?
Or are NZD bears just taking a breather?

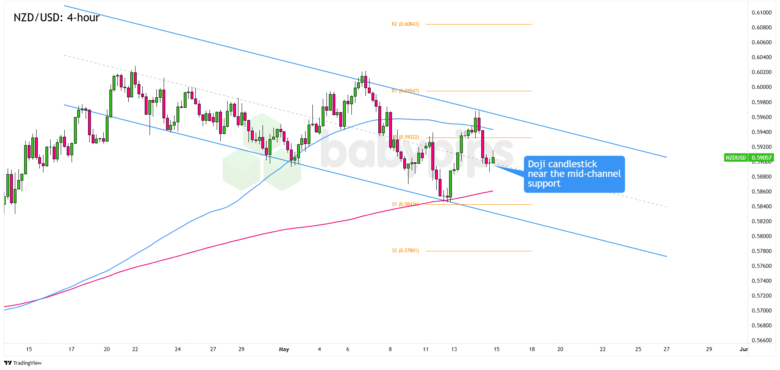
NZD/USD 4-hour Forex Chart by TradingView
NZD/USD turned lower in the last trading sessions, possibly as traders priced in fewer Fed interest rate cuts, which helped improve U.S. dollar demand.
With hardly any key economic reports coming out of New Zealand this week, Kiwi hasn’t much going for it. The pause in momentum around the U.S.-China trade truce also suggests markets are now waiting for fresh drivers.
Remember that directional biases and volatility conditions in market price are typically driven by fundamentals. If you haven’t yet done your fundie homework on the U.S. and the New Zealand dollars, then it’s time to check out the economic calendar and stay updated on daily fundamental news!
NZD/USD turned lower from the .5950 area, a minor psychological level that lines up with the top of a descending channel on the 4-hour chart. It’s now consolidating around .5900, right near the middle of that channel.
Does this mean that Kiwi’s downswing has lost steam?
Note that a Doji candlestick has appeared at the mid-channel support, which could draw in bullish pressure at the first signs of a bullish fundamental catalyst.
Green candlesticks and a clear bounce above .5900 may set the stage for a retest of the .5950 highs, with the .5932 Pivot Point and 100 SMA acting as nearby resistance.
On the flip side, a clean break below the mid-channel support and yesterday’s lows could drag NZD/USD toward the .5850 May lows, near the 200 SMA and the S1 Pivot Point at .5843.
Whichever bias you end up trading, don’t forget to practice proper risk management and stay aware of top-tier catalysts that could influence overall market sentiment!
Disclaimer:
Please be aware that the technical analysis content provided herein is for informational and educational purposes only. It should not be construed as trading advice or a suggestion of any specific directional bias. Technical analysis is just one aspect of a comprehensive trading strategy. The technical setups discussed are intended to highlight potential areas of interest that other traders may be observing. Ultimately, all trading decisions, risk management strategies, and their resulting outcomes are the sole responsibility of each individual trader. Please trade responsibly.