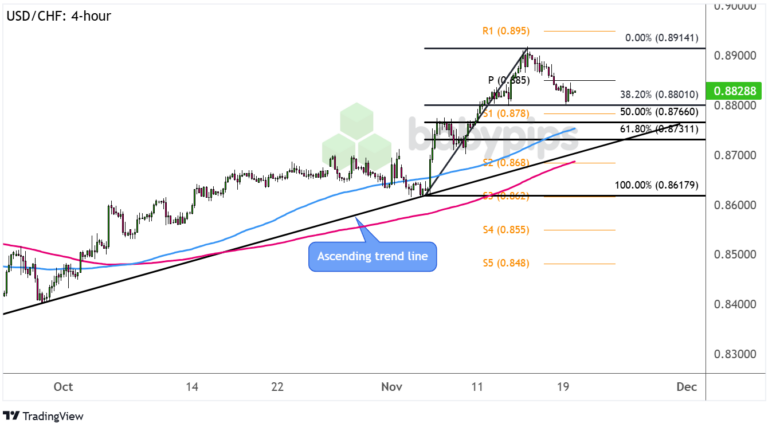
It looks like USD/CHF is in correction mode on its uptrend, but will these support zones still be able to keep losses in check?
Here’s what I’m seeing on the 4-hour chart.

USD/CHF 4-hour Forex Chart by TradingView
This dollar pair has been forming higher lows connected by an ascending trend line that’s been holding since October, and it looks like another test of support is underway.
As you can see from the chart above, USD/CHF retreated from the .8900 major psychological resistance area and is currently pulling back to the 38.2% Fibonacci retracement level.
Are buyers about to jump back in soon?
Remember that directional biases and volatility conditions in market price are typically driven by fundamentals. If you haven’t yet done your homework on the U.S. dollar and Swiss franc, then it’s time to check out the economic calendar and stay updated on daily fundamental news!
A larger correction could still take the pair down to the 50% Fib near S1 (.8780) and the 100 SMA dynamic inflection point or the 61.8% level which is much closer to the trend line support.
Be ready for a move back to the swing high or to R1 (.8950) if any of these keep losses in check while the 100 SMA is above the 200 SMA to reflect bullish vibes.
A break below these support areas, on the other hand, could mark the start of a reversal that could take USD/CHF down to the next bearish targets at S3 (.8620) at the swing low then S4 (.8550) that lines up with a minor psychological mark.
As always, watch out for other top-tier catalysts that could impact overall market sentiment, and make sure you practice proper position sizing when taking any trades!
