Is the tide about to turn for EUR/USD?
The dollar’s recent selloff is pulling the pair closer to the neckline of a classic reversal pattern on its daily chart!
Better keep your eyes on this potential resistance breakout.

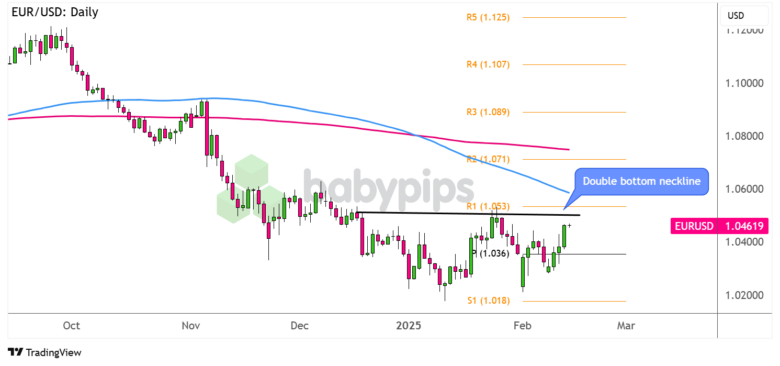
EUR/USD Daily Forex Chart by TradingView
This forex pair has made a couple of failed attempts to break below the 1.0200 major psychological mark, creating a double bottom pattern on its longer-term time frames.
Price has yet to test and break above the neckline resistance around the 1.0500 mark to confirm a potential uptrend, which could then last by around the same height as the formation.
Can EUR/USD pull off a reversal soon?
Remember that directional biases and volatility conditions in market price are typically driven by fundamentals. If you haven’t yet done your homework on the euro and U.S. dollar, then it’s time to check out the economic calendar and stay updated on daily fundamental news!
Inflation concerns and cautious Fed commentary appear to be weighing on the U.S. dollar these days, along with some risk-on flows stemming from easing global trade jitters.
With that, keep an eye out for sustained EUR/USD gains past R1 (1.0530) and the 100 SMA dynamic resistance, as this could allow euro bulls to set their sights on the next targets at R2 (1.0710) near the 200 SMA dynamic inflection point.
On the other hand, reversal candlesticks around the neckline resistance could create a range for the pair, sending it back down to the support just above S1 (1.0180) or the area of interest near the pivot point (1.0360).
Whichever bias you end up trading, don’t forget to practice proper risk management and stay aware of top-tier catalysts that could influence overall market sentiment!