Is the Kiwi getting tired from its decline?
Or are we about to see a continuation of the longer-term downtrend?
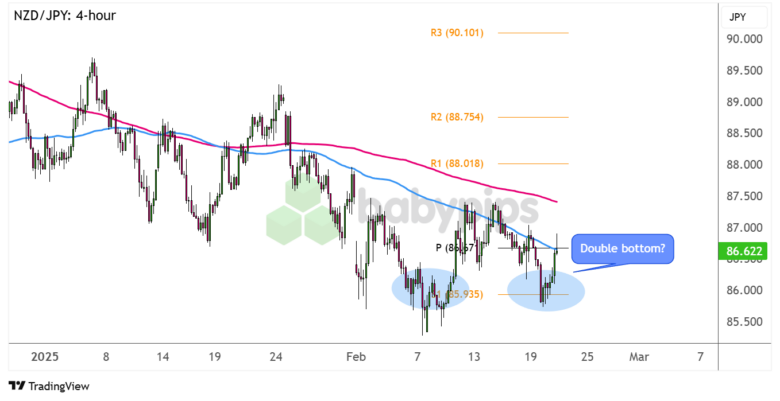
Here’s a classic reversal chart pattern I’m keeping on my radar in case NZD/JPY tests the neckline soon.

NZD/JPY 4-hour Forex Chart by TradingView
This yen pair made a couple of failed attempts to break below the 85.50-86.00 region, creating a double bottom pattern on its 4-hour time frame.
Price seems to be making some headway towards the neckline just slightly below the 87.50 minor psychological mark, and a break above the resistance could complete the reversal formation.
But can NZD/JPY sustain its climb past the neckline?
Remember that directional biases and volatility conditions in market price are typically driven by fundamentals. If you haven’t yet done your homework on the New Zealand dollar and the Japanese yen, then it’s time to check out the economic calendar and stay updated on daily fundamental news!
Earlier this week, the RBNZ cut interest rates by a massive 0.50% as expected while keeping the door open for further easing. On the flip side, BOJ rate hike speculations keep rising on account of upbeat Japanese growth and trade data.
Still, improvements in risk-taking appear to have weighed on the safe-haven yen on account of progress in Russia-Ukraine peace talks while boosting the demand outlook for commodities.
On the chart above, the 100 SMA is still below the 200 SMA to suggest that the selloff is more likely to resume than to reverse, and the gap between the indicators is widening to reflect strengthening bearish vibes.
Just be sure to keep an eye out for long green candlesticks piercing through the double bottom neckline, as these could suggest that an uptrend of the same height as the formation is due.
Whichever bias you end up trading, don’t forget to practice proper risk management and stay aware of top-tier catalysts that could influence overall market sentiment!