EUR/GBP has been pacing back and forth inside a range that’s been holding since November last year.
The pair is closing in on the top, so could it be due for a bounce or a break?
Better keep these nearby inflection points on your radar!

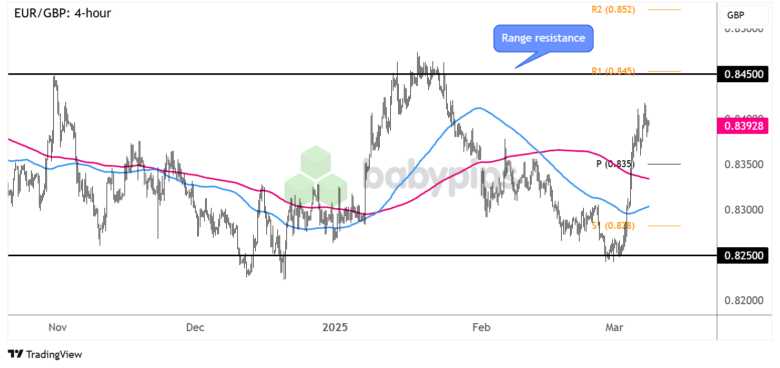
EUR/GBP 4-hour Forex Chart by TradingView
Shifting monetary policy biases for the European Central Bank (ECB) and Bank of England (BOE) since late last year have mostly kept this pair inside a range visible on the 4-hour time frame.
While the ECB has reiterated its data-dependent approach to easing, BOE policymakers have had a “finely balanced” and “dovish split” decisions highlighting a tight battle between hawks and doves.
Can these policy biases remain intact and keep EUR/GBP inside its range?
Remember that directional biases and volatility conditions in market price are typically driven by fundamentals. If you haven’t yet done your homework on the Japanese yen and Canadian dollar, then it’s time to check out the economic calendar and stay updated on daily fundamental news!
The pair is nearing the range resistance at the .8450 minor psychological mark and R1 (.8450), which could attract some selling pressure back to the nearby support zones.
If the ceiling holds, watch out for a dip back to the middle of the range at the pivot point (.8350) or all the way back down to support at the .8250 minor psychological mark.
Still, keep your eyes peeled for potential bullish candlesticks busting through the range resistance and suggesting that a rally of the same height as the chart pattern could follow. Do look out for a potential bounce off the next upside target at R2 (.8520) as well.
As always, watch out for other top-tier catalysts that could impact overall market sentiment, and make sure you practice proper position sizing when taking any trades!