Don’t look now, but bitcoin seems to be showing increased signs of upside momentum!
Does this mean that the altcoin is poised to test its record highs or form new ones soon?
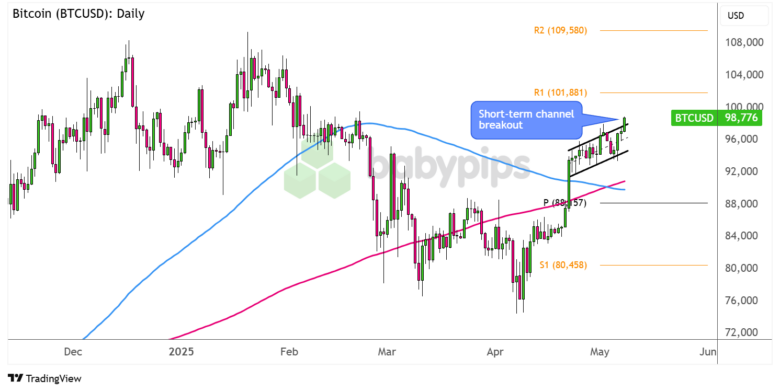
On its daily chart, BTC/USD recently busted through its double bottom neckline but has since consolidated inside a short-term rising channel.

Bitcoin (BTC/USD) Daily Chart by TradingView
Improving sentiment in the crypto industry and a relatively cautious Fed statement appear to be taking bitcoin above its brief holding pattern just below the key $100K level.
Can it climb past this strong psychological barrier and make it all the way back up to all-time highs?
Remember that directional biases and volatility conditions in market price are typically driven by fundamentals. If you haven’t yet done your homework on bitcoin and the U.S. dollar, then it’s time to check out the economic calendar and stay updated on daily fundamental news!
Although BTC/USD has been trading above both the 100 SMA and 200 SMA to reflect bullish vibes since mid-April, the moving averages just made a bearish crossover that could still attract sellers.
In this case, keep an eye out for potential dips within the short-term ascending channel or back down to the area of interest near the pivot point level ($88,157) if the latest rally fails to gain traction.
On the other hand, sustained upside momentum past the $100K mark and the next upside barrier at R1 ($101,881) could clear the way for another test of the record highs around $108K-109K and R2 ($109,580).
Better stay on the lookout for potential profit-taking at this zone or for long green candlesticks that suggest bitcoin bulls aren’t backing down anytime soon.
Whichever bias you end up trading, don’t forget to practice proper risk management and stay aware of top-tier catalysts that could influence overall market sentiment!